A while back I attended a “Debugging .Net Applications” course taught by John Robbins from Wintellect. I loved the course and ever since I’ve grown more and more fond of WIndbg. I absolutely love how it can quickly take an issue and lead you to the core problem.
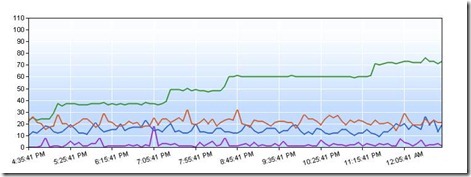
A few weeks ago, we noticed in one of our pre-production environments incrementally increasing CPU utilization in our ASP.Net application:

Key:
- Proc - green
- %GC - purple
- Requests per second - blue
- Avg request time - red
Windbg works best if you have a hypothesis that you want to test. We had a few theories. Our best theory was that we had a process that gets into an infinite loop, and each time it does, it maxes another processor core (these are 8 core servers). We expected IIS to protect us from runaway requests, and if there really was an infinite loop, why weren’t we seeing a StackOverflowException, but this was still our best guess. We set out to test it.
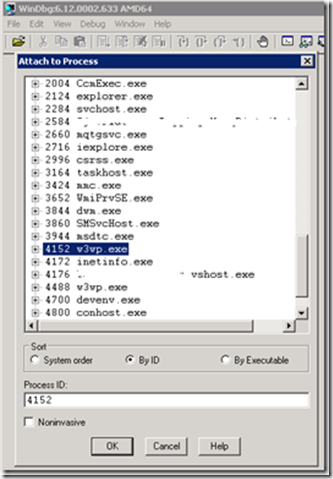
First, we captured a dump by attaching Windbg to the apppool running our application. Find the process id for the app pool of interest:

Then attach WinDbg to the process:

Then, get the dump from Windbg by issuing
.dump /ma /u e:\dumps\highCpuThis will create a dump file with a timestamp on the file name containing all the information we need to debug both native and managed code. We could also just do the debugging while we are attached the process, but I wanted to copy the dump off to another machine to do the analysis. Now, in Windbg, load up the dump file and psscor2:
.load psscor2The first command I ran was !runaway. !runaway tells us the time spent by each of the processes threads executing user mode code. You can pass additional parameters to show time spent in kernel mode as well, but for this case, we’re only interested in user mode. The time reported is the time spent executing code since the thread was created. Here is the top of the results:
0:073> !runaway
User Mode Time
Thread           Time
33:1724          1 days 16:42:13.985
39:17d4          1 days 15:00:01.087
40:1a30          1 days 2:38:40.506
34:1808          0 days 15:50:55.446
41:174          0 days 9:35:21.695
46:260          0 days 8:59:35.480
The top three threads look interesting. That’s a lot of execution time (in fact, the top thread is almost the entire time since the last deployment). Let’s switch to thread 33 and see what we can find. I’m not including the stack trace here, but running these commands switches to the suspicious thread and shows the clr stack:
~33s
!clrstack
What I noticed when looking at the stack of the top three threads is that they were all in the same method. Very suspicious! Looking at that method, we found this:
private static IEnumerable<foo> GetAncestors(Foo foo, ControllerContext controllerContext)
{
   while (foo.ParentId.HasValue)
   {
      int parentId = foo.ParentId.Value;
      foo = controllerContext.GetFoo(parentId, true);

      if (foo == null)
      {
         yield break;
      }

      yield return foo;
   }
   yield break;
}
If there was a circular reference in a chain of Foo’s, we’d never exit this loop. The fix turned out to be easy. We keep track of which ancestors we’ve already returned, and if we come across the same one twice, we throw:
private static IEnumerable<foo> GetAncestors(Foo foo, ControllerContext controllerContext)
{
   var ancestorIds = new HashSet<int>();

   while (foo.ParentId.HasValue)
   {
      int parentId = foo.ParentId.Value;

      if (ancestorIds.Contains(parentId))
      {
      throw new InvalidOperationException(
         string.Format(
         "There is a circular reference in the ancestors of Foo '{0}'.",
         foo.Id));
      }

      foo = controllerContext.GetFoo(parentId, true);

      if (foo == null)
      {
         yield break;
      }

      yield return foo;
   }
   yield break;
}
The investigation took all of about 15 minutes, the code fix about 10 minutes more, testing and deployed all in 5 hours. Windbg is quickly becoming one of my favorite debugging tools!