Thursday, September 2, 2010

Resolving TFS error TF14087: Cannot undelete X because not all of the deletion is being undeleted

At work, we recently encountered this error in TFS when trying to merge from our trunk into a project branch. There’s some information on the internet about this error, but none of them directly applied to our issue. Thankfully, one of the benefits of having Microsoft as a parent company is access to TFS engineers.

We got into this situation when someone deleted a folder in the trunk and then re-added a folder with the same name. And then deleted it. And re-added it. When you do this without merging between the delete and adds, TFS gets real confused. It tries to merge the delete and the add (and in our case, the second delete and second add), and because they are all the same name and path, you get TF14087.

The solution (thanks George) was pretty simple:
Get the deleted id for all of the deletes of the folder:

tf dir /recursive /deleted /slotmode $/project/trunk. 

This gives output like:

$/project/trunk:
$Build
$Configs
$Databases
$Deploy
$Docs
$External
$Folder
$Folder;X246937
$Folder;X246938

In our case, there are three entries for $Folder, two with deleted ids, and the one folder that has not been deleted (the last add).
Destroy the deleted folders by using their deleted ids.

tf destroy /preview $/ijv/trunk/folder;X246937

Adding the /preview argument let’s you confirm what would be done when issuing the destroy command. After you review the output and make sure you’re not destroying something you don’t mean to, remove the /preview and run the command.

Then we run it for the other deleted id:

tf destroy /preview $/ijv/trunk/folder;X246938

Finally, do the merge from the trunk back into the project branch.
That resolved the issue for us. We lost the history of the original two versions of that folder, but it did allow us to move forward with merging. Hopefully this information will help someone when trying to resolve the same issue.

Tuesday, May 25, 2010

My love affair with WinDbg (or high CPU utilization in ASP.Net and the runaway iterator)

A while back I attended a “Debugging .Net Applications” course taught by John Robbins from Wintellect. I loved the course and ever since I’ve grown more and more fond of WIndbg. I absolutely love how it can quickly take an issue and lead you to the core problem.
A few weeks ago, we noticed in one of our pre-production environments incrementally increasing CPU utilization in our ASP.Net application:
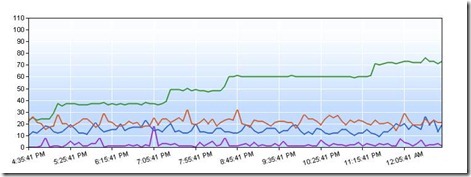
Key:

  • Proc - green
  • %GC - purple
  • Requests per second - blue
  • Avg request time - red

Windbg works best if you have a hypothesis that you want to test. We had a few theories. Our best theory was that we had a process that gets into an infinite loop, and each time it does, it maxes another processor core (these are 8 core servers). We expected IIS to protect us from runaway requests, and if there really was an infinite loop, why weren’t we seeing a StackOverflowException, but this was still our best guess. We set out to test it.

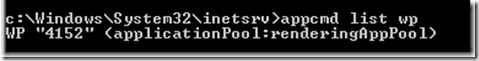
First, we captured a dump by attaching Windbg to the apppool running our application. Find the process id for the app pool of interest:

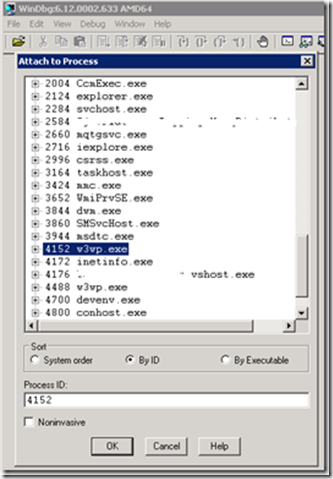
Then attach WinDbg to the process:

Then, get the dump from Windbg by issuing

.dump /ma /u e:\dumps\highCpu

This will create a dump file with a timestamp on the file name containing all the information we need to debug both native and managed code. We could also just do the debugging while we are attached the process, but I wanted to copy the dump off to another machine to do the analysis. Now, in Windbg, load up the dump file and psscor2:

.load psscor2

The first command I ran was !runaway. !runaway tells us the time spent by each of the processes threads executing user mode code. You can pass additional parameters to show time spent in kernel mode as well, but for this case, we’re only interested in user mode. The time reported is the time spent executing code since the thread was created. Here is the top of the results:

0:073> !runaway
User Mode Time
Thread           Time
33:1724          1 days 16:42:13.985
39:17d4          1 days 15:00:01.087
40:1a30          1 days 2:38:40.506
34:1808          0 days 15:50:55.446
41:174          0 days 9:35:21.695
46:260          0 days 8:59:35.480

The top three threads look interesting. That’s a lot of execution time (in fact, the top thread is almost the entire time since the last deployment). Let’s switch to thread 33 and see what we can find. I’m not including the stack trace here, but running these commands switches to the suspicious thread and shows the clr stack:

~33s 
!clrstack

What I noticed when looking at the stack of the top three threads is that they were all in the same method. Very suspicious! Looking at that method, we found this:

private static IEnumerable<foo> GetAncestors(Foo foo, ControllerContext controllerContext)
{
   while (foo.ParentId.HasValue)
   {
      int parentId = foo.ParentId.Value;
      foo = controllerContext.GetFoo(parentId, true);

      if (foo == null)
      {
         yield break;
      }

      yield return foo;
   }
   yield break;
}

If there was a circular reference in a chain of Foo’s, we’d never exit this loop. The fix turned out to be easy. We keep track of which ancestors we’ve already returned, and if we come across the same one twice, we throw:

private static IEnumerable<foo> GetAncestors(Foo foo, ControllerContext controllerContext)
{
   var ancestorIds = new HashSet<int>();

   while (foo.ParentId.HasValue)
   {
      int parentId = foo.ParentId.Value;

      if (ancestorIds.Contains(parentId))
      {
      throw new InvalidOperationException(
         string.Format(
         "There is a circular reference in the ancestors of Foo '{0}'.",
         foo.Id));
      }

      foo = controllerContext.GetFoo(parentId, true);

      if (foo == null)
      {
         yield break;
      }

      yield return foo;
   }
   yield break;
}

The investigation took all of about 15 minutes, the code fix about 10 minutes more, testing and deployed all in 5 hours. Windbg is quickly becoming one of my favorite debugging tools!

Monday, February 8, 2010

Reclaiming disk space from Outlook OST files

I recently received a warning for Windows telling me I was dangerously low on disk space on my laptop’s C: partition. I intentionally don’t put a lot on my C: because I like to be able to pave my machine’s OS frequently without having to worry about backing up my data, so my C: partition usually only has the OS and applications. I have 40 GB dedicated to my C: partition, and I have never bumped up against any space constratints.

I ran WinDirStat to see what was taking up so much space. Aside from the usual suspects (pagefile.sys and hiberfil.sys), I saw two large files, below in green (the two reds are pagefile.sys and hiberfil.sys)

Turns out they are two OST files connected to my two Exchange accounts (Outlook 2010 lets you have multiple Exchange accounts in a single profile - very cool!). Each OST was using over 10 GB of space! I frequently archive my mail to PST files (located on another partition), so I was surprised the OST’s were so big.
The solution was to compress the OST files. I had forgotten that you can compress not only PSTs but also OSTs. Here’s the steps: (Again, this is Outlook 2010. Previous version may be slightly different.)

  1. Close Outlook.
  2. Open the Mail control panel applet.
  3. Click the Data Files button.
  4. Select the file associated with your Exchange account. It’s named with your default email address.

  5. Next, click the Outlook Data File Settings button.

  6. Finally, click Compact Now. Sit back and wait - It takes a while. For my 10GB file, which compressed down to about 5GB, it took about 3 hours.

I was able to quickly reclaim 11GB of disk space on my C: partition by compressing my OST files. Hopefully this will help someone else with the same predicament!

Friday, January 22, 2010

Subversion error: Could not read status line: Connection was closed by server

I’ve recently setup a local Subversion server for a project I’m working on with some other guys. It took a bit of convincing that having multiple developers on a project requires a source control system. Prior to the past few months, there’s only been one developer working on the project (for the past 18 years!), so they’ve never needed version control. OK, well, they didn’t think they needed version control. Version control was simply making a copy of the folder before you start making changes.

I’ve not worked with Subversion much in the past, but it was super-simple to setup and get VisualSVN installed and running (thanks Scott Hanselman for the tips!).

Anyway, I’ve been using the repository here locally via TortoiseSVN without any issues at all. I sent the connection instructions to the other guys and one of them called today saying he received an error when trying to enlist in the repository:

Could not read status line: Connection was closed by server. 

Ugh, I thought. Since I don’t have a lot of Subversion experience, I thought I was up against some obscure issue that would take a long time to figure out. Turns out the solution was quite simple: he was attempting to connect to the server via http, but it only accepts https connections. Putting in the correct protocol solved the problem! I do think the error could be a little more descriptive…